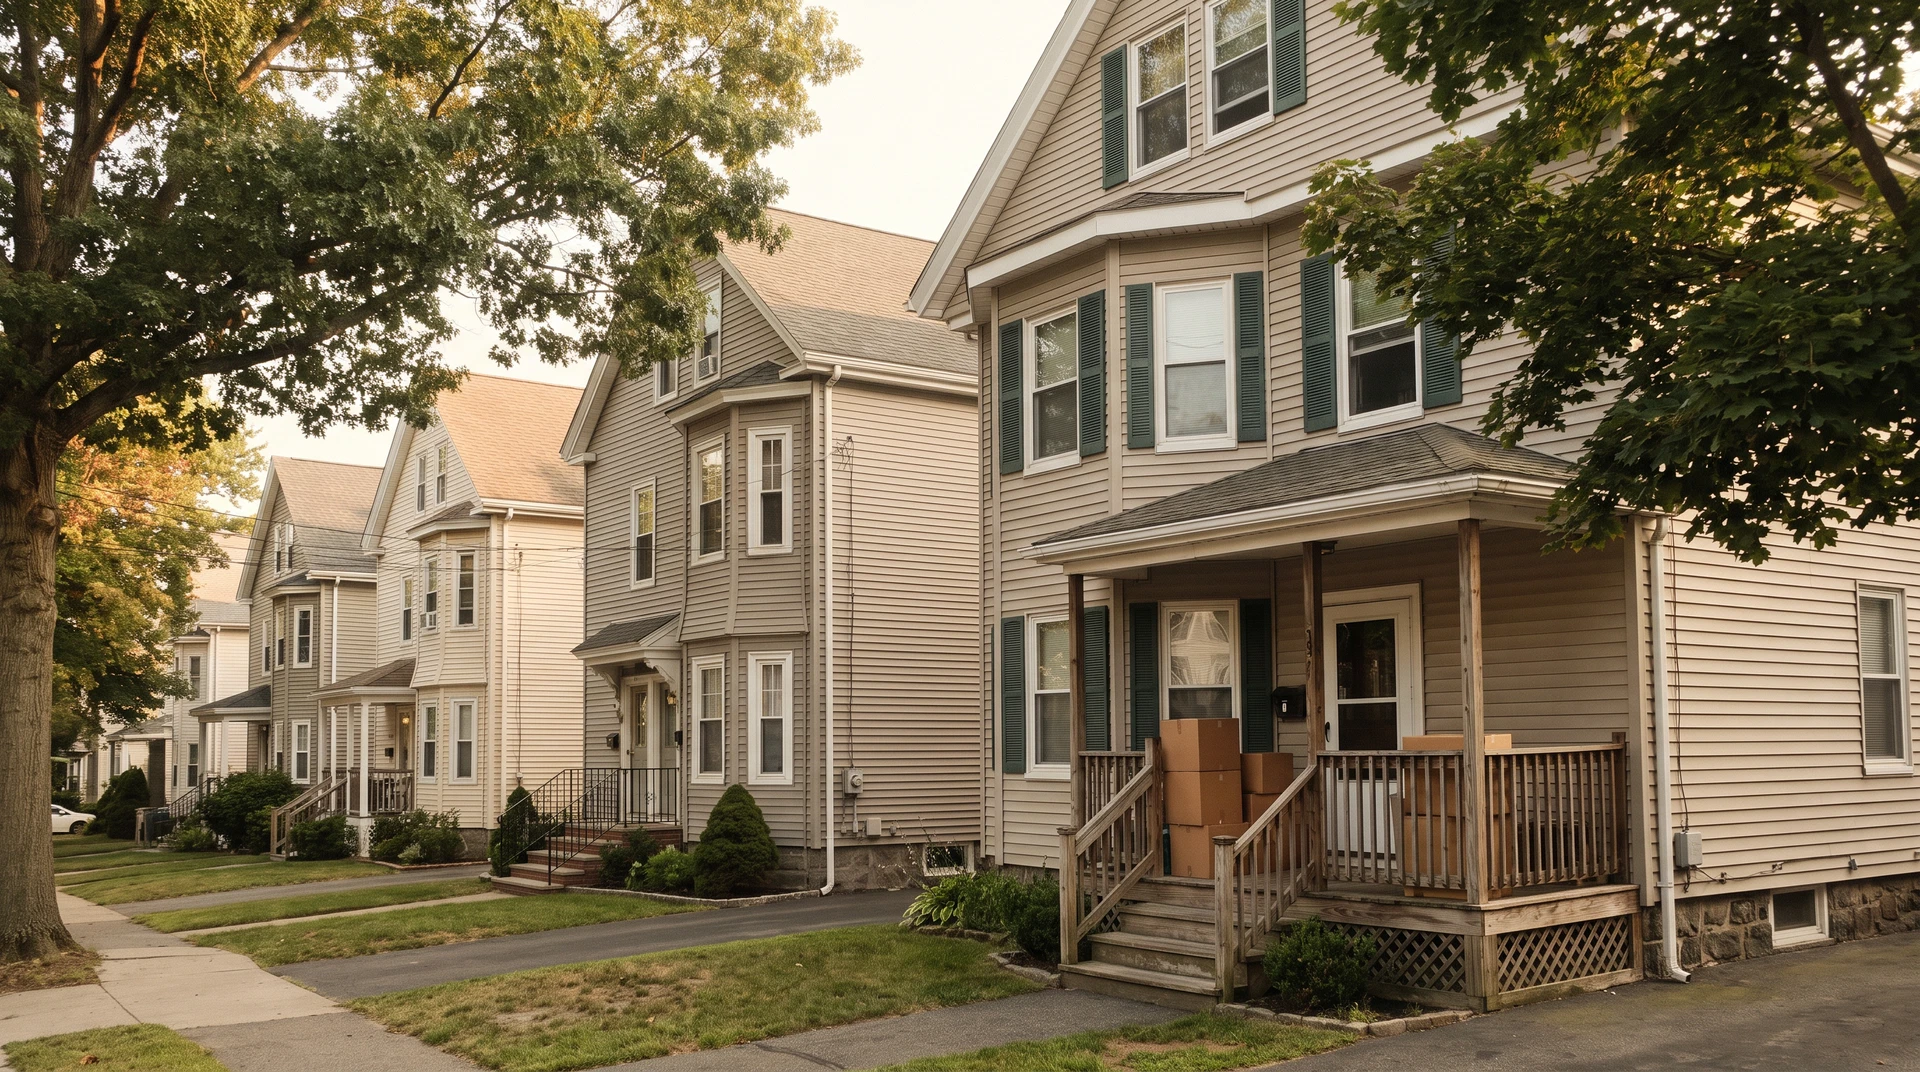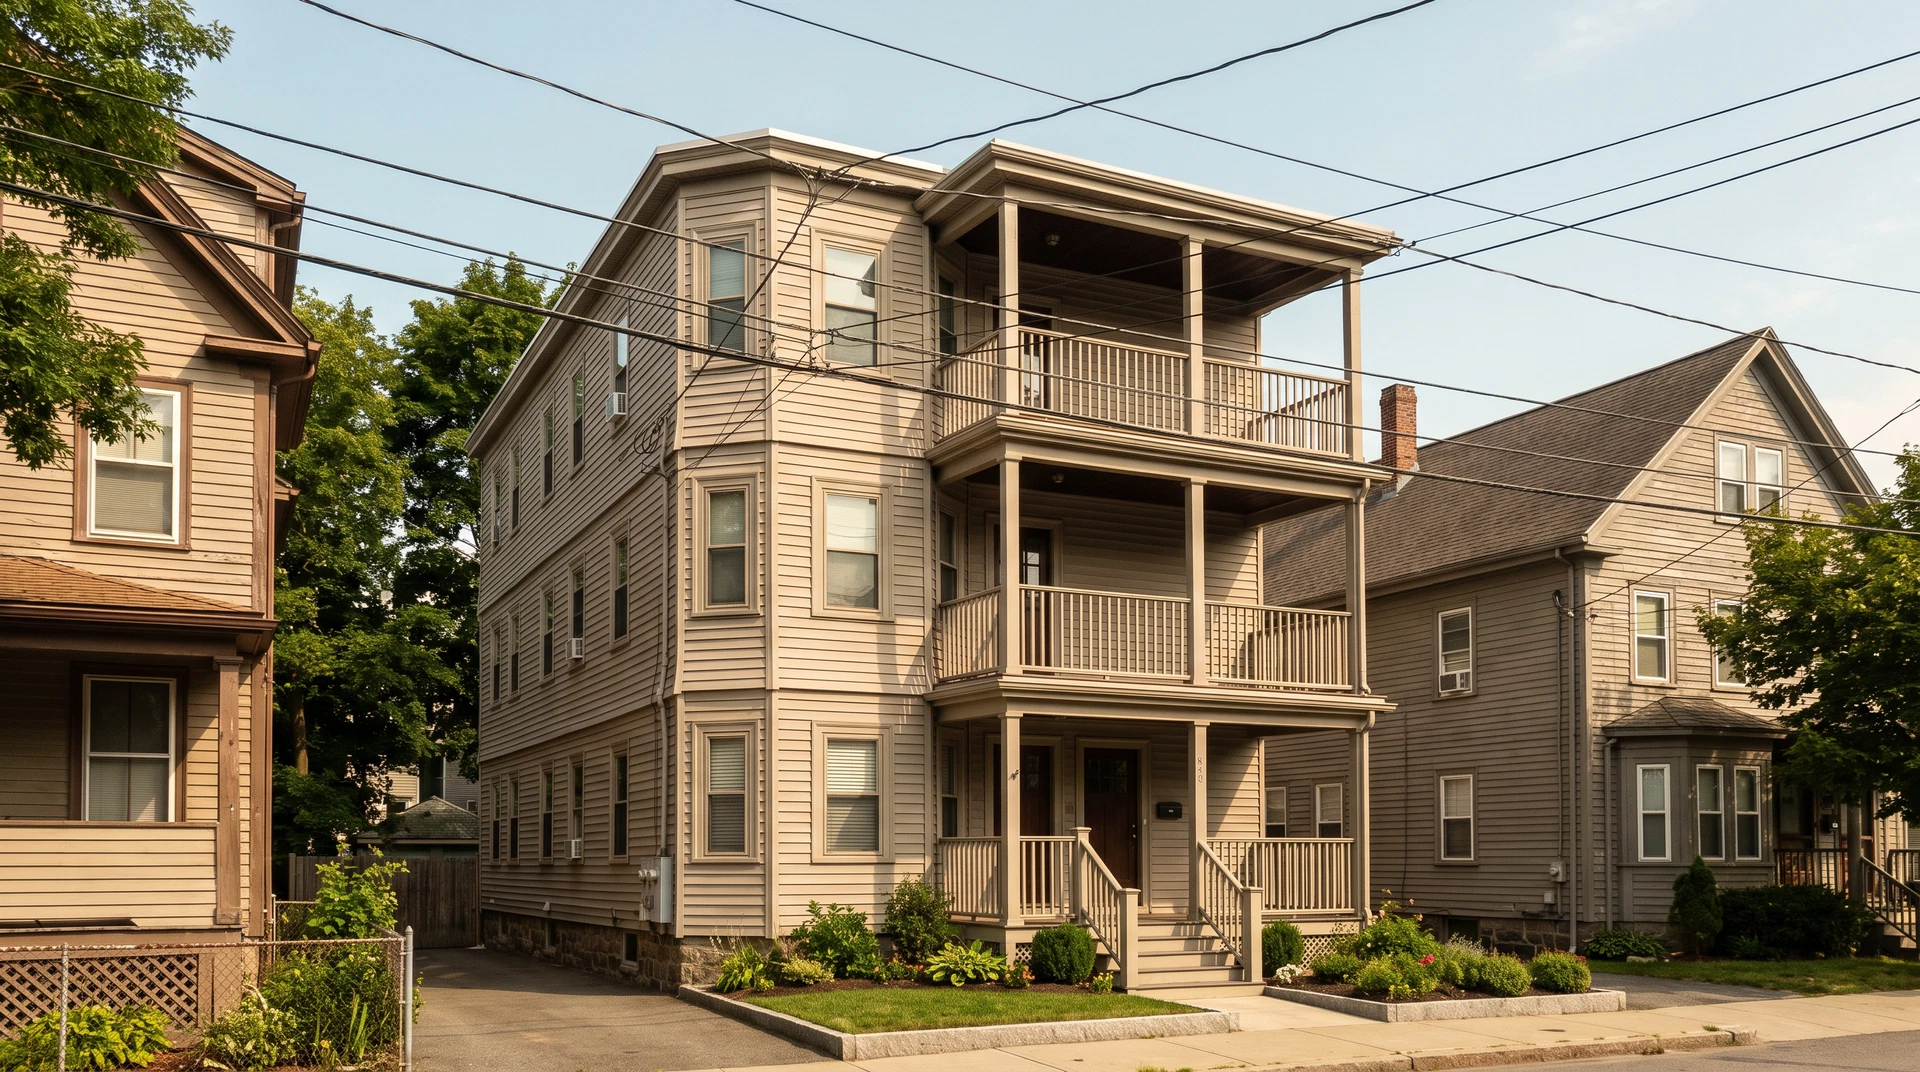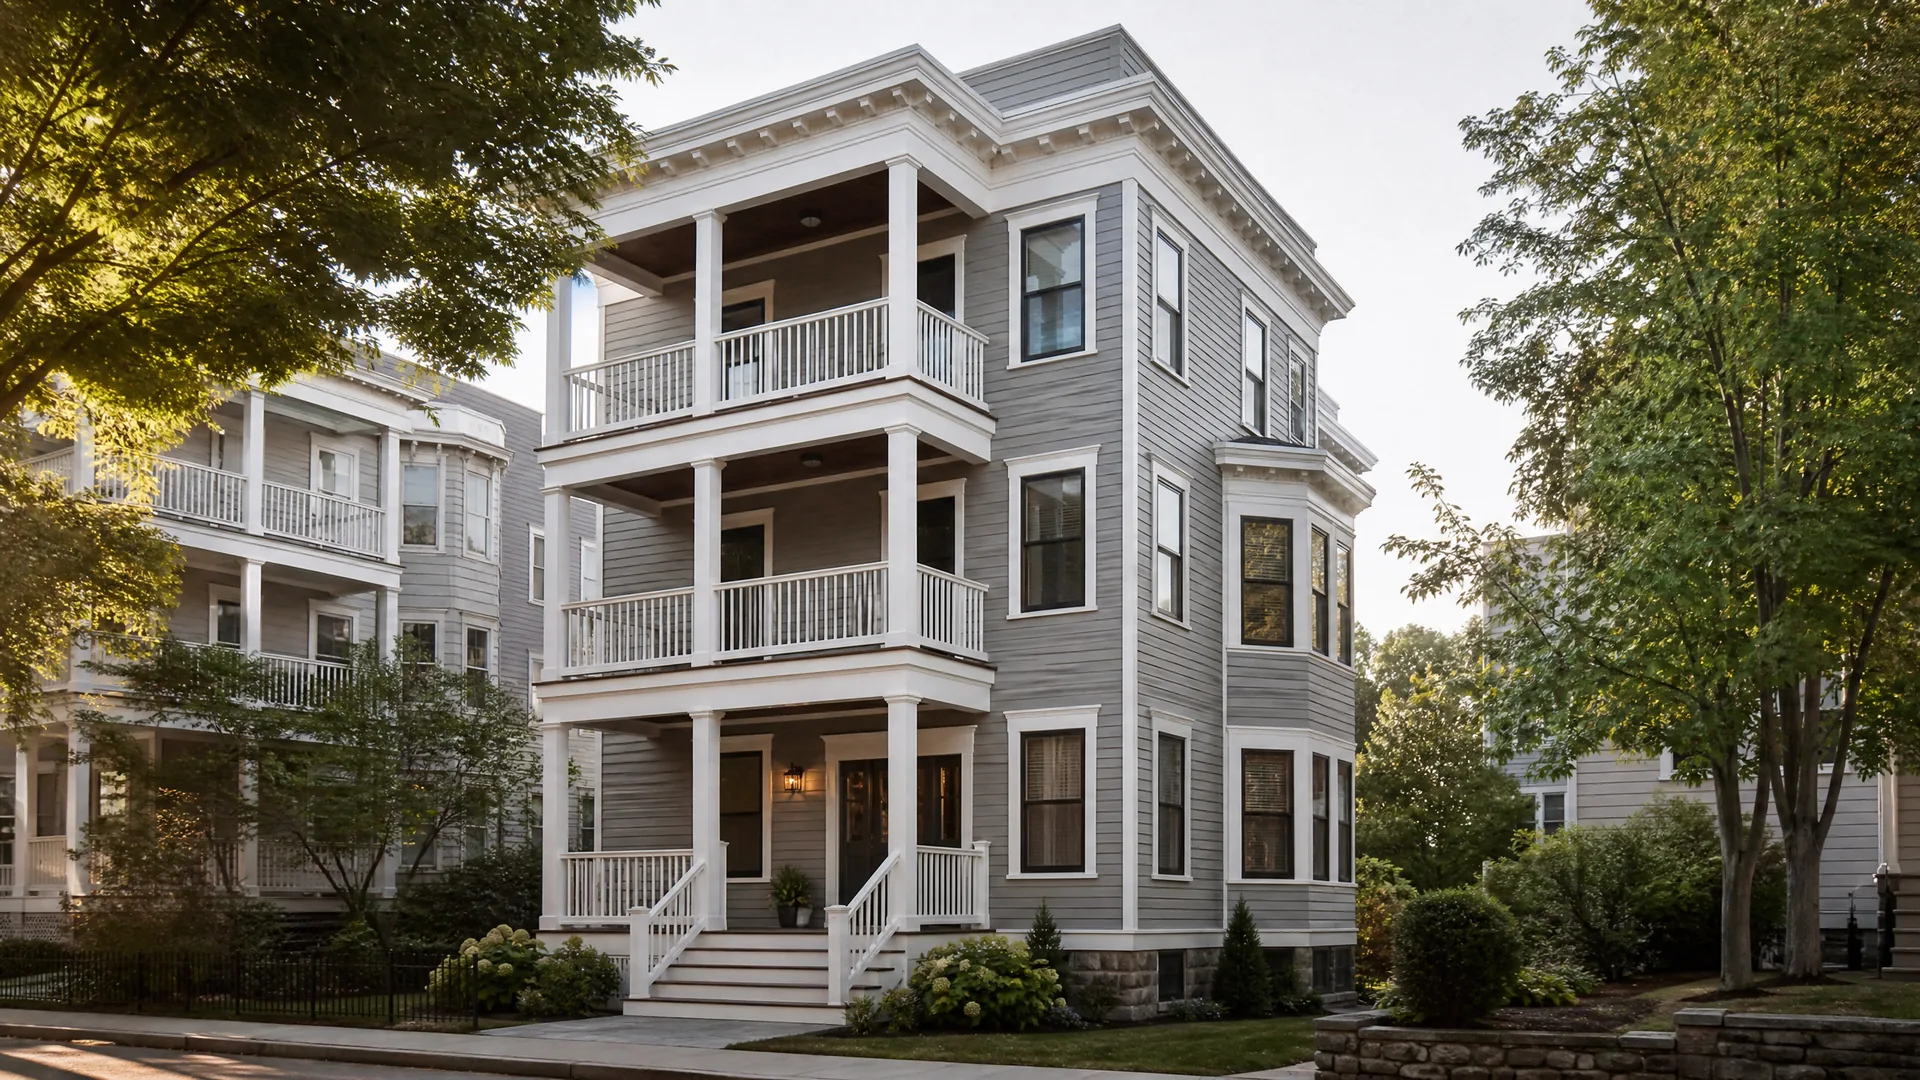
Before you fall for a two or three family's charm, run the numbers. A good multi-family analysis is not complicated, and it protects you from a building that looks great and loses money. Here are the metrics that matter and how to read them.
Here is the short version. Start with real income and real expenses to find net operating income. From there you get cap rate, cash-on-cash return, and whether the rents cover the mortgage. In high-price Greater Boston, the numbers are often tight, so honest inputs matter more than optimistic ones.
Who this applies to
New and experienced investors looking at two, three, or small multi-family buildings in Greater Boston and on the South Shore, including house hackers who plan to live in one unit and rent the others.
Step 1: Build real income
Add up the actual or realistic market rents for every unit. Use true market rent, not a hopeful number, and if a unit is vacant or under-rented, use what it would actually command today. Include any extra income like parking or laundry.
Step 2: Use real expenses
List every operating cost: property taxes, insurance, water and sewer, any owner-paid utilities, maintenance, repairs, and property management even if you plan to self-manage, since your time has value. Add a vacancy allowance, since no building stays full forever. As a rough rule of thumb, operating expenses can run near half of rent on smaller multi-families before the mortgage, but always model from the actual tax bill, insurance quote, and maintenance history rather than a fixed percentage.
Step 3: Find net operating income
Net operating income, or NOI, is your annual income minus your operating expenses, not counting the mortgage. NOI is the engine of every other number, so get it right.
Step 4: Read the key metrics
| Metric | What it tells you | How to read it |
|---|---|---|
| NOI | Income after operating costs, before the loan | Higher is better, and it drives the rest |
| Cap rate | NOI divided by price | Compares buildings regardless of financing |
| Cash-on-cash return | Yearly cash flow divided by cash invested | Your actual return on the money you put in |
| Debt service coverage | NOI divided by the mortgage payment | Above 1 means rents cover the loan |
| Expense ratio | Expenses as a share of income | Lower is better, but be realistic |
Step 5: Stress test it
Run the deal with a higher vacancy, a repair year, and a slightly lower rent. If it still holds up, you have margin. If it only works when everything goes perfectly, that is a warning. In Greater Boston, where prices are high and rates are in the mid 6 percent range, many market-priced buildings barely cover the mortgage on day one, so your long-term thesis often rests on appreciation and loan paydown, not instant profit.
The bottom line
A clean multi-family analysis moves from real rents to real expenses to NOI, then to cap rate, cash-on-cash, and debt coverage. Use honest inputs, stress test the deal, and buy a building the numbers support over time, not one that only works on a perfect spreadsheet.
For the other side of the same math, when you already own the building and are deciding whether to keep it, see my guide on whether a rental is still worth holding.
FAQ
Common questions, answered.
What is a good cap rate?
It depends on the area and property, and Greater Boston cap rates tend to run lower than cheaper markets. Compare similar buildings in the same area rather than chasing one number.
What is cash-on-cash return?
It is your annual pre-tax cash flow divided by the actual cash you invested. It tells you what your money is earning in year one.
Why include management if I will self-manage?
Because your time is worth something, and you may not always self-manage. Including it keeps the analysis honest.
Do Greater Boston multi-families cash flow?
Often not much at today's prices and rates. The long-term return usually comes from appreciation and paying down the loan, not day-one cash flow.
Monthly Market Recap
Get the Greater Boston market recap, once a month.
Prices, inventory, and what it actually means for buyers and sellers around Quincy and the South Shore.